Archive for March, 2013


I’m going to employ The Fibonacci Retracement tool to help explain the movements seen in Magnolia’s stock price throughout the last few months. Firstly though, I shall use it on a stock which is at a further stage in the cycle which should give us an insight into the value of the tool and an insight into what Maggie could do in the near future. I compared  Magnolia to Sirius Minerals not so long ago but on a more ad-hoc basis, comparing the general pattern and percentage retracements. One could probably call the previous comparisons a little crude. I hope now to look at the two a little more formally and give a better overview of what we could see happen with Magnolia very soon.

Put simply, The Fibonacci Retracement Tool is applied across an extreme high (100%) and low (0%) in the stock price, and between these two levels various horizontal lines of support/resistance can be drawn. Their particular locations are determined by the Golden Ratio which returns values of support and resistance at the following percentage levels from the extreme high: 23.6%, 38.2%, 50%, 61.8%. See the below chart of Sirius Minerals and it should come together:

Fibonacci Retracement SXX

For a shorter term horizon, one could trade the spreads between these retracement levels but this is not why I use them. This tool tells us where likely points of a turnaround exist, with the lowest point being at the 23.6% level. Sirius rebounded off this lowest level and went on to more than double in value to 30p.

Given that the fundamental picture remains in tact and is assumed to continue to strengthen, this 23.6% level should mark the lowest point of the down trend and the optimal entry point to ride the coming rebound and upward trend. With this in mind, let’s look at the current position Magnolia Petroleum finds itself in:

Fibonacci Retracement MAGP

When applying the same procedure to Magnolia’s high and low points, we find that the share price has arrived at the 23.6% level. Strengthening this level as the lowest point in the trend is the fact that this is the price that the previous peak reached and the potential development of a double bottom pattern (see the two lows circled above).

If Magnolia follows in the footsteps of Sirius, we should see the stock bottom out here and develop a strong upward trend.

SXX Planning Delay


On March 21st I stated that “from what I had read lately I believed that there would be delays to the current time plan” regarding the planning application for the sinking of the York Potash mine. On Wednesday, Sirius announced that this was indeed to happen. The planning decision has been pushed back  from mid-May to a revised date of 2nd July 2013. Ultimately, this is very positive news indeed because it gives both sides more time to digest the information provided and it allows Sirius to sufficiently meet any current and future holding objections with the information that is requested. It also appears that the current holding objections are being nullified in a professional and successful manner and should therefore not be a cause for concern going forward. The MoD is currently independently reviewing the information Sirius has now provided and an answer is expected in the coming weeks.

Regardless of this, a significant period of time has been wedged between today and a potentially phenomenal re-rating. I still think that this will propel investor fingers to press the ‘sell’ button out of impatience and frustration, and thus a slide in the share price in the short term. After all, if you can stay in the certainty of cash and buy nearer the time you save yourself a risky period of trading where not very much is likely to happen.

Although, the expected upgrade of the resource from inferred to indicated is to be released in May, but it is difficult to say what affect this will have on the share price because the planning approval could be a rather looming limiting factor. I would guess that the magnitude of the rise we observe will give us an indication of the market’s expectation of the likelihood of planning being passed. If we see the share price rocket  it would suggest that the market reckons that planning will simply be a formality and require no further mention. On the other hand, if nothing much is seen in the share price after the indicated upgrade then this would certainly tell us that the resource value is meaningless until it can legally be mined.

The share price as of late has been impressively volatile with huge volumes trading hands in the past few trading days. The price slipped temporarily to as low as 18.25p but aggressively regained ground to settle at the current closing at 20p, still some 7% below my previous purchase price of 21.6p and, more importantly, below the 200-day SMA. We can see that the candlesticks found support at 19.75p which was created around October time last year (see the above chart). If we now consult the weekly chart with the aid of the Ichimoku Cloud we see a more informative picture:

SXX Long


We can clearly see that this is uncharted territory for Sirius. Each of the last down trends has passed between the clouds. Notice historically that the candlesticks cross through the shaded areas where they are thinnest, and each time it occurs it strengthens the pattern for the future. But we can see that this time the candlestick has sliced straight down into the cloud and has just rested the lowest intraday price at the bottom of the cloud.

As those who have yet to invest here have time on their side and little reason to invest for now I would not be surprised to see the lower lining of the cloud to be re-tested. Whether we slip through and retreat to the lows of 13-15p is uncertain, but presently I don’t think this to be very likely unless further proverbial spanners are thrown into the works.

Once the dust settles in the next couple of weeks we will have a better idea as to whether we will see a better share price than what we see now. The fundamental picture has certainly improved but this rarely is reflected immediately in the share price. In fact, I am bargaining on this phenomenon to hold true here so that a good entry price can be realised for round two on this apparent roller-coaster.

EME COver

From the delirious highs of 158p to the shocking lows of 3.50p, Empyrean Energy is certainly one of the more well-travelled shares. The company floated in mid-2005 in order to pursue oil and gas opportunities in geopolitically stable regions of the world. In line with this stated strategy, the Board carried out a series of acquisitions in the first couple of years. They begun with the now very much defunct Glantal Gas resource near Frankfurt, Germany. This was followed shortly by working interests in California and Texas: the Eagle Oil Development Project (now 57% working interest) and the Sugarloaf Project (3% WI), respectively. And finally, in 2009 the company acquired a 10% working interest in the Riverbend Project, also situated in Texas. There were a couple of other projects but they are not worth going into detail here.

EME Long Term

Throughout the years a number of problems were encountered in each of the working interests acquired, and the share price reflected this. Hence the depressing dive down to 3.50p in 2009, a mere 9% of the IPO share price. The Glantal Gas Project never produced meaningful results and news flows regarding it ceased fairly promptly. The Eagle Oil Project in California turned dormant during 2006 after a well was drilled and abandoned due to “technical problems”. Of what kind one can only speculate. The Riverbend Project in Texas remained largely undeveloped although one successful well was drilled which still produces oil and gas today.

All this talk of failure shall here-on halt, for Empyrean have and continue to drag their assets back from the cliff-edge and into production.  Their saving grace was the Sugarloaf Project which targets the Eagle Ford Shale in Texas. The resource has proven to be one of the most productive unconventional oil and gas plays in the USA ever. When the scale of this project’s potential was learned it promptly became the primary concern and other project developments were halted to conserve capital.

The project was originally operated by Hillcorp Energy, but in 2012 operatorship was transferred to Marathon Oil. The new company entered the scene with an aggressive drilling schedule which was implemented from Q2 2012. This was welcome news for Empyrean because a heavier drilling schedule meant that production rates would be ramped up at a significantly quicker pace.

After a year of Marathon in control, the number of producing wells on Empyrean’s acreage has increased by over 200% from 24 producing wells to over 72. This has entirely transformed the company’s flow rates. In March 2012, Empyrean was producing around 125 boe/d (barrels of oil equivalent / day) while in March 2013, only a year on, production rates are expected to be five times greater at circa 800 boe/d. Put simply, this is unprecedented growth. All of which has entirely been ignored by the market, as can be seen by the depressed share price.

EME Shorter Term

This proposed undervaluation is supported when we consider the most recent Independent Reserves Report (IRR) for Empyrean’s acreage on the Sugarloaf Project. The report, issued in December 2012 increased proved reserves of oil by 54.4% to 2.32 MMBBL (million barrels of oil). If we ignorantly multiply this by an assumed price of $90 for one barrel of oil we come to an undiscounted aggregate revenue amount of $209M.

A more conventional gauge of value would be to refer to the NPV of the reserves. However, the latest IRR did not disclose them for fear of unwelcome predators, so we can only refer to the IRR issued in October 2011 which estimated the 1P reserve NPV to be $30.8M. Note that this figure does not capture the 54.4% increase in reserves, nor does it capture the accelerated drilling schedule and it also does not account for the year that has passed for discounting purposes. We can therefore safely and conservatively estimate the NPV by increasing this figure by about 60% – the 54.3% plus a little more to account for the change in drilling schedule-  which returns a figure of $52M. I would like to now remind the reader that the current market cap for Empyrean Energy is currently $20M.

So it would appear that Empyrean is trading significantly beneath its estimated NPV value for the proven reserves of the Sugarloaf Project and we have not even considered the Riverbend or the Eagle Oil Projects, each of which have considerably larger working interests, although admittedly do not share quite the same stellar quality as Sugarloaf.

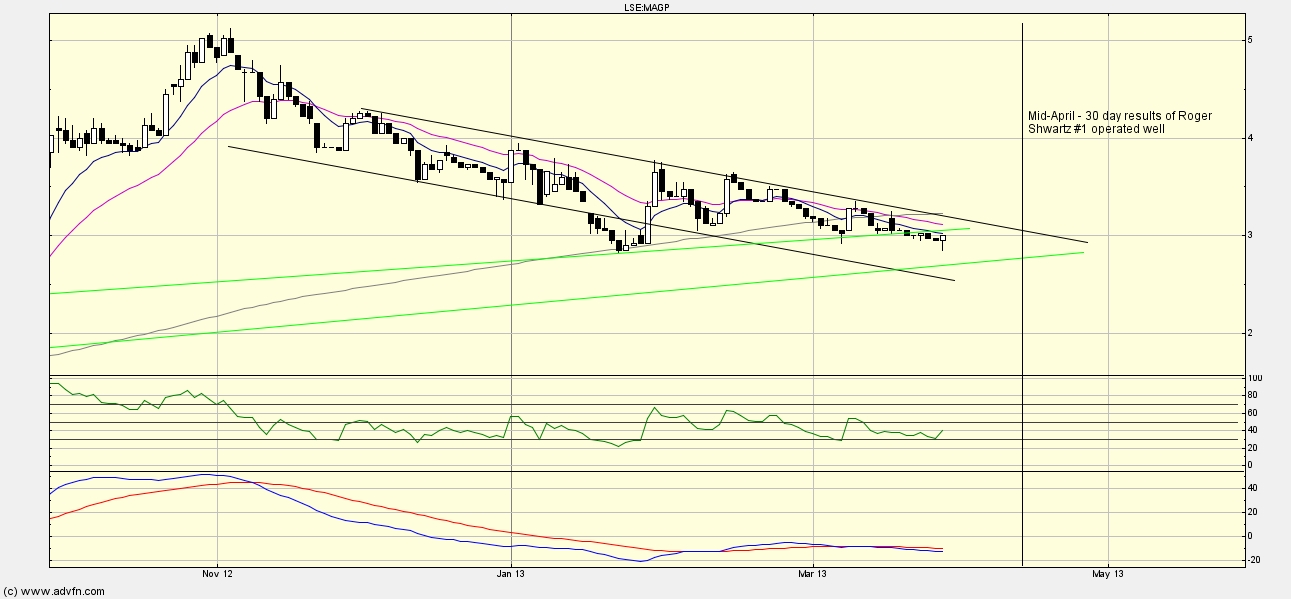
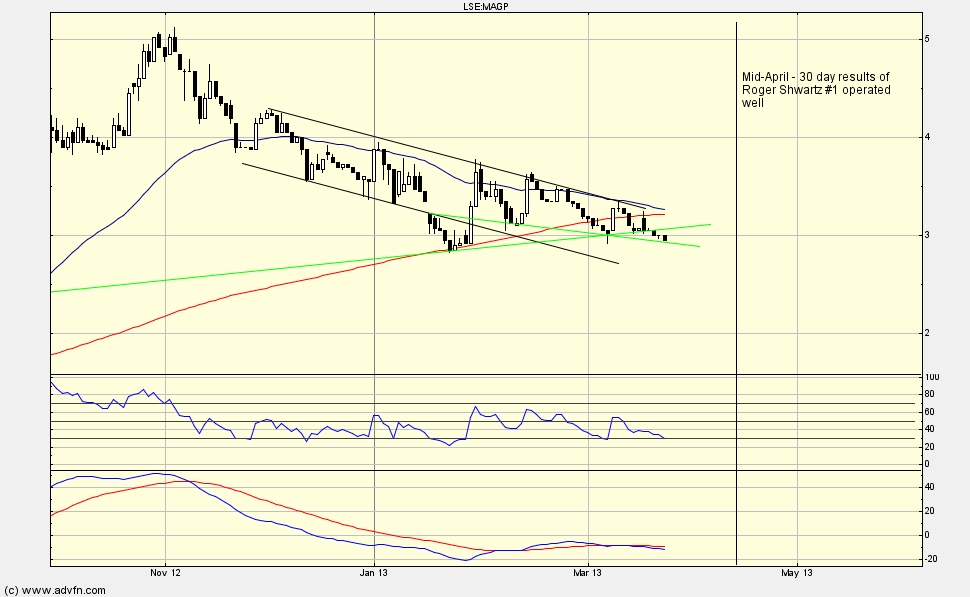
This punishment by the market could be down to the share’s historical under-performance, causing investors to remain wary and sceptical of Empyrean’s apparent turnaround. After all, official proof of the value I speak of has not shown itself yet. A proposed event which should give us ample proof would be the year end results. A significant ramp up in revenues and profits would flag to the market that considerable value exists where it previously had not been accounted for. It is not long now until the annual results are released, so the truth may be out soon.

I will continue this new thread with further information on Empyrean’s operations, including the more recent developments and I shall also paint the technical back-drop.

MAGP BUY


I entered the market this morning and took a position in Magnolia Petroleum, which now amounts to 13% of my portfolio. I’ve sat on the sidelines now since late December when its shares were selling for around the 3.75p mark. I am pleased to announce my cost per share was decidedly lower at 2.89p, effectively allowing me to pick up 23% more shares for the same capital.

Between December and today I have been firmly in the bear camp, willing the price to drop further for an attractive entry. More recently I stated my expectation that the stock would slide considerably after it failed to hold both the 200-day SMA and the long-term upward support (the higher green line on the graph). As we can see it has been two weeks since the 200-day SMA fell and one week since the support fell, and neither triggered strong selling. This should suggest to us that the bearish sentiment has fizzled out, as any other stock in the midst of a down trend, when faced with a broken 200-day should only react in one way, and that way is overwhelmingly downward.

Coupled with this subtle positive signalling, volume lately has reduced down to a trickle of buys and sells, which suggests again that those selling have run dry. Often this is seen at the end of a down trend and it is sometimes followed by one last slump downward before overwhelming buying pressure assigns the bulls as the operator once again.

As can be seen above, today saw selling push the price down back to the low levels seen in late January. The mid price dropped to as low as 2.85p when an unknown investor with exceedingly deep pockets purchased a colossal 2,000,000 shares for a net total of £57,000. After seeing this, it confirmed my thinking that this is not going to get much cheaper than this. Hence, I purchased about 5 minutes after. Fortunately, this did not push up the asking price to quickly and I was offered a price not far off from his. Since the large buy 90% of further trades have been buys as well. It just goes to show that the financial markets are driven by few and followed by many.

Snoozing Toumaz

TMZ Snoozes


Toumaz has been entirely immobile for over a week now, resting at the bottom of the trend. Much of the reasoning behind it is the lack of investor interest since the annual results were pushed back a month to 25/04/13, and of course the lack of news flow is another factor. I, like many other investors, are anxious to hear further news on the Sensium trials in the US but as of today we are still in the dark. We can only refer to historical information telling of encouraging results thus far.

Meanwhile, there has been news elsewhere in the same market space regarding the lifestyle & fitness adaptation of a Sensium-like technology. A private company named Isansys has developed very similar technology to that used in the Sensium plaster which is to be implemented in body monitoring systems during exercise. It can return information on heart rate, breathing rate and others, so the site says. The company which is using Isansys’ tech is called Cloudtag, a newly listed AIM company. What is pleasing about this development , however, is the revelation that Toumaz will be supplying Cloudtag with a certain chip for their product.

When I learned of this news regarding another company with such similar intellectual property (IP) I seriously considered selling my holding in Toumaz. The notion came about because this news puts the company’s market edge in danger. Fortunately though, we know Toumaz to currently be in a stronger position than Isansys because it already has its product being tested in hospitals. Additionally, the company have the significant backing of billionaire entrepreneur and investor Patrick Soon-Shiong who is involved with the Toumaz US venture. This is the arm which deals with the Sensium distribution in the USA. Isansys are safely a year or so away from the stage Toumaz finds itself in.

We are currently at very attractive purchasing levels and so I would not be surprised to see a push north from here soon. Although, this would be made more difficult without the catalyst of news flow. Considering that the trial results will probably be held until the release of year-end results it is not very likely that we will hear much until then.

Alas, I am resigned to patiently waiting. In the red for now, but this was always going to be a long-haul investment. A turnaround could well be just around the corner.

Sirius Freefalling

SXX Freefall


At the time of writing, Sirius stock was fetching a meagre 20.6p on the bid. Note that this is not reflected in the above chart because of the time lag attributed to the ADVFN Charts Service. Hargreaves Lansdown, my online broker, is currently recording sells being executed at aforementioned levels. My series of sales throughout last week and before would now appear to have been the correct call after all. Although, in a perfect world I should have sold at an earlier time than I did, but when we consider that the alternative outlook  today had I not sold would have been a rather ugly red spread telling of losses, I cannot really complain.

Today’s candlestick is currently resting on the long term 200-day SMA, something which I did not think we would see happening so soon. Currently we are seeing sells below the 200-day SMA, but what is significant is whether we close for the day below it. Watch out for this. Another pitfall to be aware of is the likely level where investors have set their stop loss orders. This is an order which is automatically executed to make sure the downside of one’s investment is capped. Quite often investors set these stop loss orders where they perceive there to be significant support, like at long term averages. If/when this level is found we usually see a torrent of selling.

It would seem that investors are violently bailing out of this stock. I do not think that this is the end of the selling, however. We have slipped below the previous support which can be seen above as the green horizontal line at 22p. The stock might rebound in the coming few trading days and retake this level and turn it back to support, but sentiment is eroding so quickly the likelihood of this move holding is small.

I retain my cold seat on the sidelines, ready and waiting with cash in hand for a window of opportunity.

200BDI VLCCF


Market analysts have been recently predicting the largest turnaround in the dry bulk market since the Crisis in ’08 with a broad target date of 2013. Whether we are seeing it play out currently is the million dollar question. The derivative of the expected growth is from commodity demand, with specific focus on the demand for iron ore which is largely carried by the largest of the dry bulk carriers, the 182,000 dwt Capesize carriers. Knightsbridge currently own 4 such carriers, with two to be constructed by 2015.

Since January 2013 the Baltic Dry Index – BDI – which represents a measure of the price of charter rates for dry bulk cargo carriers, has appreciated by 30% to a value of 933. This is about 50% up on the all-time low of 2009. Throughout 2012 the BDI languished marginally above this all-time low of 666 but made no material move upward, reflecting the bleak market outlook which derived from the exceptional carrier oversupply.

Below is a relevant excerpt from Knightsbridge Tankers’ most recent quarterly report which supports the current whisperings of a rebound:

“There are a few factors which make most analysts fairly optimistic for dry bulk demand growth going forward. Quality of Chinese domestic iron ore production is on a steady declining trend. Since 2007 China has invested roughly $85 billion in iron ore mining. Over the same period investments per effective ton iron ore produced has increased from $15 per ton in 2007 to $60 per ton in 2012. Adjusting for falling Fe content, effective iron ore production in 2012 is broadly at the same level as in 2007. Even in a modest steel growth scenario for China most forecasters believe in a continued strong growth in iron ore imports”.

What is interesting about this movement in the BDI as of late is that Knightsbridge is in lock-step with it. Intuitively, this makes sense: The company’s profitability predominantly rides on the charter rates it can attain for its dry bulk fleet. If charter rates go up, the BDI reflects this positively and so does the value of Knightsbridge. Now the company is a wholly dry bulk shipping company, it may be that the market views it as an adequate vehicle to capture the dry bulk market performance, and hence it closely tracks the BDI.

Whether this appreciation in the BDI is supported fundamentally is difficult to say. Fortunately, the thesis for investing here does not ride on whether there is a significant turnaround in the market this year. The deployment of the company’s cash will certainly provide added income over the short-term.

MAGP Continued Slide


The budding oil and gas minnow has held up well these past two weeks. It has not slipped so violently below the 200-day SMA as I had expected and looks to be falling only out of the minority’s impatience rather than an underlying consensus of overvaluation. It has today, however, fallen and held below the long-term support line which doesn’t bode well for those already invested here.

I have drawn on the chart what I estimate to be the earliest time when we can hear of the Roger Shwartz #1 well’s production figures. This is a much anticipated RNS because the well is operated by Magnolia, rather than the company taking a passive interest only. If successful, it could mark the beginning of a much stronger rate of growth. It is the Board’s intention to spread into operatorship in the long-term so the Roger Shwartz well could be the realisation of their delivering on their strategy, which up to now has proven to be successful.

However, we know that the company prefer to err on the conservative side of what they like to have the market expect, and in line with this characteristic they have a policy of issuing production figures only after 60 days. This better reflects the future production flow because often the first 30 days an abnormal level of flow is recorded from the initially intense pressure. So we may have to wait until late May, but the Board may decide to give some kind of indication regarding the flow perforance prior to this in order to put the market at ease.

All these things taken into account, I still believe that there may be a cheaper entry point between today and the announcement of the Roger Shwartz production figures. It could well be the next dip as the RSI is on the curb of oversold status. When the TSI bands return to the very low levels of -20 it could signal the bottom of the long retrenchment from 5p. Beyond the trough the ensuing upward trend certainly has the potential to push past the all-time high of 5p.

To conclude my last post on MAGP, I spoke of the impending Death Cross pattern where the 50-day SMA crosses over the 200-day SMA. You can see on the above chart that this has not yet happened but could potentially do so next week.

I Sold Sirius

SXX Sold

The Q&A session between Sirius Minerals and the North York Moors National Park Agency NYMNPA was detailed today in the local online newspaper: The Real Whitby. If you would like the details I recommend you seek it out. From reading it, it would appear that there are some important shortfalls in the information provided by the Board so far. Here are just a few: underwater river systems and their potential disruption, the impact on tourism, increase in traffic, the feasibility and functionality of the novel underwater potash transportation system, the use of the void space in the future… The list goes on.

All these information requests reduces the likelihood of the planning application’s approval in May. Ultimately, I do believe that York Potash will exist as a functioning mine one day, but from what I have read lately I believe that there will be delays to the current time plan. I am, however, confident that the Board are probably the best in the business, and if they cannot get this Potash out of the ground then no-one on this Earth can. Regardless, I have decided to sell the remaining holding I had this morning at 23.64p.

To date, I have made a net gain on my Sirius investment of 7%. This is not too bad, considering it consisted of half my entire portfolio. I certainly intend on becoming a shareholder of SXX in the near future, and I expect to be able to do so at a more attractive price than my initial average of 21.6p.

There are a number of occurrences which could arise in the coming weeks before May 21st which could lead to an attractive entry point. The main one is the potential for any party to request the SoS (Secretary of State) to relinquish responsibility of the proposal from the NYMNPA and make the decision himself. I think this will determine the outcome positively but this is known to carry a time delay of up to six months for the decision to be announced. Saying that, the government have recently issued policies which intend to reduce the length of time planning permission proposals take so it could be much sooner. Neertheless, it will still cause a shock to the share price because investors will simply sell out and buy back nearer the time.

Such an outcome may also negatively impact Sirius’ current cash position. Further delays may lead to emergency placings to prop up cash burn. This again will send the share price south.

Finally, Boulby Potash have yet to submit their response to the planning application. Needless to say, I would be surprised if they vote in favour of it. York Potash intend to develop the same type of potash, Polyhalite, as what Boulby already produce in a currently exclusive market. I’m not sure how much weight is attributed to their opinion, however. At any rate, it is an added risk.

Of course, none of the above may come to light and so we would therefore bounce around these levels until the most important day of Sirius’ short life arrives. If this occurs, I will likely invest about 6% of my total capital prior to the announcement, and if the outcome is favourable I will heavily increase my holding for the ensuing rise. If the outcome is negative, I will promptly sell my small holding and repurchase at a significantly lower price. I would reinvest only if there are sure signs that the Board intend to resubmit the application soon.

I feel that this approach is more conservative than my original strategy as there are sure to be adverse swings between now and D-Day. I am now free to take advantage of them if I wish and financially immune  to these windfalls should they come about.

Knightsbridge Tankers announced to the market this morning that it has contracted Japan Marine United Corporation for the construction of two 182,000 Capesize newbuilds. The carriers will be built and delivered during 2015, meaning that the company will have expanded its fleet by 50% in the dry bulk market by this time. Due to the current environment in which tanker firms currently operate, the Board have been able to negotiate very attractive terms for the contract. They have been acquired for a good price which should allow for superior returns on those assets for years to come.

Additionally, the Board announced the disposal of their final VLCC (Very Large Crude Carrier) – The Mayfair – to an unrelated third party. The sale was struck at a marginal discount to book value, confirming the continued weakness in the crude oil tanker market. It would appear that Knightsbridge jumped ship at a good time. Thanks to the sale, the company banked $4M after repayment of debt. This roughly cancels the most recent dividend payment.

Both these decisions are in line with their current strategy to reposition Knightsbridge in the dry bulk market where the Board believes there to be more attractive risk-return ratios, as well as to renew & update the fleet.

The company are looking to be in great shape and well-placed to successfully operate in their chosen environment. As of today, there have been no details released regarding the figures of the contract. So it is difficult to say whether the company have the liquidity to purchase further Capesize carriers to increase their fleet size in the shorter term. Regardless, the company are directing themselves in the desired and expected direction, and I am confident that this will continue to be the case.