
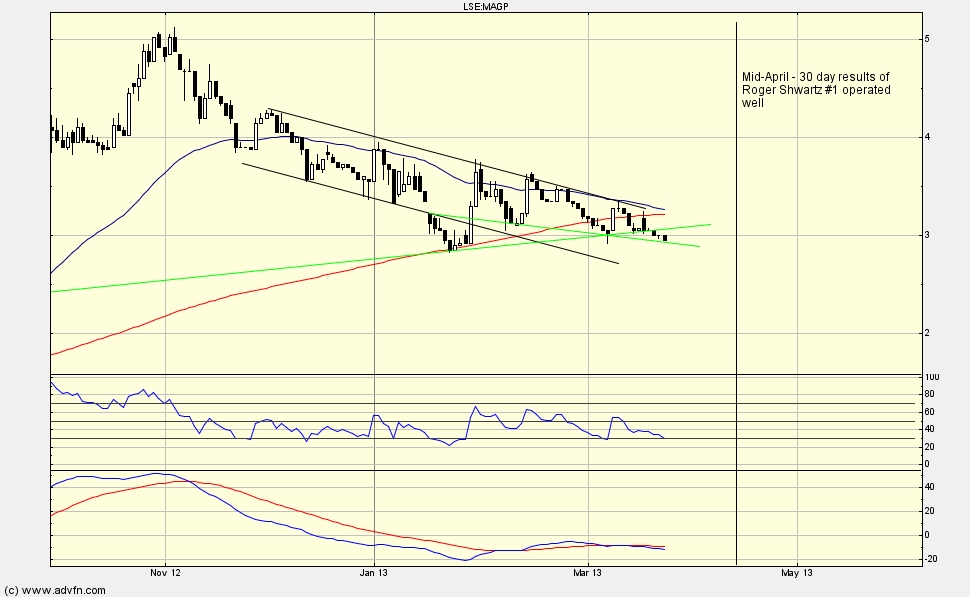
The budding oil and gas minnow has held up well these past two weeks. It has not slipped so violently below the 200-day SMA as I had expected and looks to be falling only out of the minority’s impatience rather than an underlying consensus of overvaluation. It has today, however, fallen and held below the long-term support line which doesn’t bode well for those already invested here.
I have drawn on the chart what I estimate to be the earliest time when we can hear of the Roger Shwartz #1 well’s production figures. This is a much anticipated RNS because the well is operated by Magnolia, rather than the company taking a passive interest only. If successful, it could mark the beginning of a much stronger rate of growth. It is the Board’s intention to spread into operatorship in the long-term so the Roger Shwartz well could be the realisation of their delivering on their strategy, which up to now has proven to be successful.
However, we know that the company prefer to err on the conservative side of what they like to have the market expect, and in line with this characteristic they have a policy of issuing production figures only after 60 days. This better reflects the future production flow because often the first 30 days an abnormal level of flow is recorded from the initially intense pressure. So we may have to wait until late May, but the Board may decide to give some kind of indication regarding the flow perforance prior to this in order to put the market at ease.
All these things taken into account, I still believe that there may be a cheaper entry point between today and the announcement of the Roger Shwartz production figures. It could well be the next dip as the RSI is on the curb of oversold status. When the TSI bands return to the very low levels of -20 it could signal the bottom of the long retrenchment from 5p. Beyond the trough the ensuing upward trend certainly has the potential to push past the all-time high of 5p.
To conclude my last post on MAGP, I spoke of the impending Death Cross pattern where the 50-day SMA crosses over the 200-day SMA. You can see on the above chart that this has not yet happened but could potentially do so next week.
