
Shares of Gemfields have been enjoying a good run these past few weeks, with prices quickly gaining over 45% to peak at 27.875p. The underlying fundamental catalyst was the announcement of the highly favourable revenues banked from the most recent ‘higher quality’ gemstone auction. Despite being hosted in the controversial Lusaka, Zambia it was a stunning (and personally surprising) success and ranked as the second-most lucrative in the gemstone miner’s short history. The company amassed a total of $31.5m over the three day event with all lots being sold.
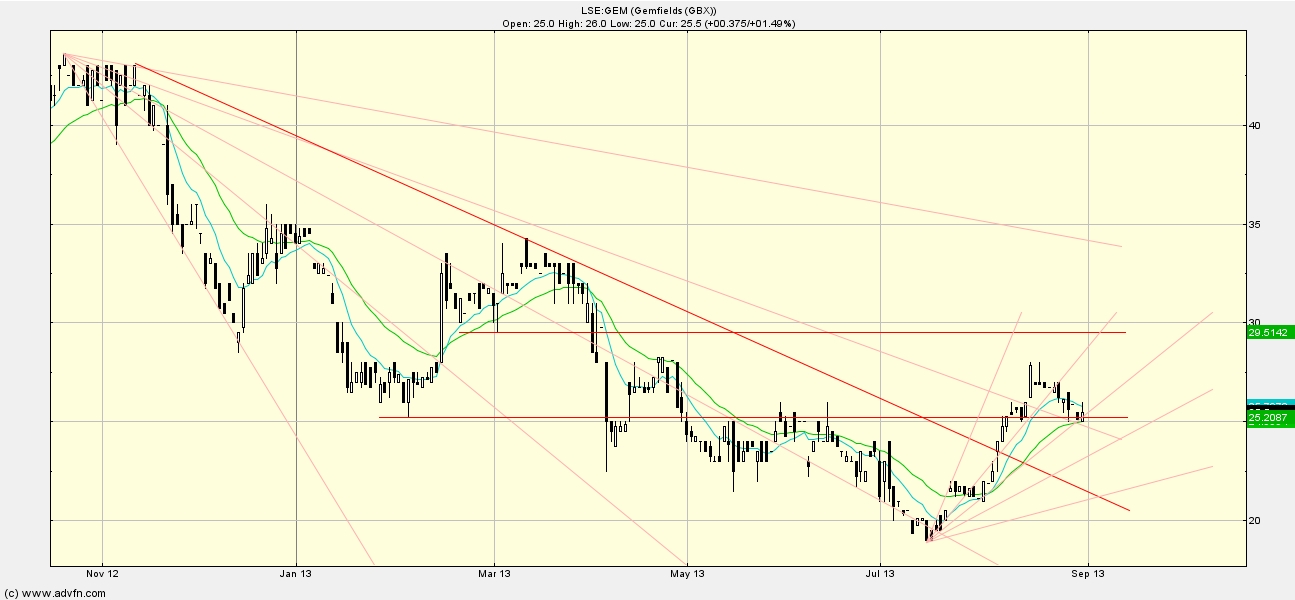
These recent gains have brought about an interesting technical pattern which I shall now discuss further. Please see the below chart:
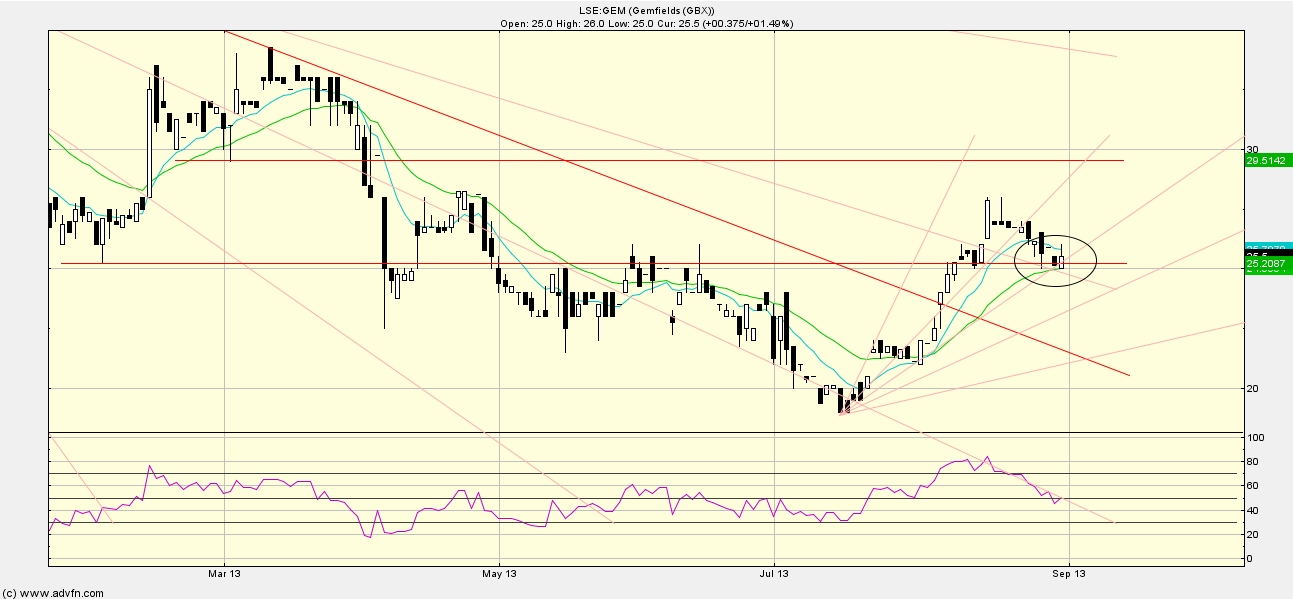
As you can see the stock is currently playing out a modest pull-back from the 27.875p high made a couple of weeks ago. Investors and traders would have been looking for an opportunity to take some profits off the table and I believe this is what we are currently seeing now. Note the RSI (bottom chart) sustained a level of heavy over-buying throughout the latter part of the upward burst. Traders take this signal as a sign to de-risk their holding.
We are now, however, at a point which could potentially bottom and rebound upward once more. This is circled on the chart and is the all-important inflection point, or trough. The stock has found multiple levels of support at this price. One derives horizontally from lows made back in pre-March which we can see hampered attempted reversals all the way through the summer. The second – which is of slightly lesser strength because it has not been tested multiple times like the former trend line – is a Speed Resistance line which derives from the multi-year high of 43.6p made back in Q4 2012 (off-chart here). The third is a relatively new upward Speed Resistance line anchored at the more recent 19p low. Finally, the fourth support is the slower simple moving average. These four levels of support act as a cradle for the candlestick and should provide significant downside protection. If it is strong enough it should allow the stock to make further gains, and soon.

From a weekly perspective (above), Gemfields is also becoming more attractive. The candlesticks have breached and held the first Fibo level, with the pull-back described earlier falling neatly atop of it. This upward movement and bullish sentiment is also closing the spread of the weekly TSI ( bottom chart) which, upon crossover, should officially set the stock in up-trend mode.
The next important target investors should be eyeing is the second Fibo level at 28.5p, some 12% above current trading levels. Such a move should have the momentum to force the TSI cross-over which is a signal I especially look for to give reassurance that the recent bullishness has the intention of remaining for a reasonably amount of time going forward.
I am comfortable with the movement so far and I look forward to the confirmation of the weekly upward trend. Given this occurs, we should see the stock close on fair value.
Investors should also keep an eye on new projects out in South America. Gemfields has been advertising for positions out there on their site for a while now and could lead to an exciting new side-journey surprise. Also on the back-burner is the promotion out of AIM, something which should significantly benefit the stock price.
In aggregate, Gemfields as an investment presents a great deal of blue sky upside and very little downside. I look forward to what the coming months may bring for this exciting and ambitious little African miner.
